qwen3.5-plus · go
go
- config
- qwen3.5-plus--opencode-go--dev
- batch
- 2026-07-19--unified
- transport
- opencode-go-gateway
- protocol
- api · plan
- served model
- qwen3.5-plus
- 采集于
- 2026年7月18日 11:54 · N=2
variant
live
slot 0 · P-q · sandboxed iframe
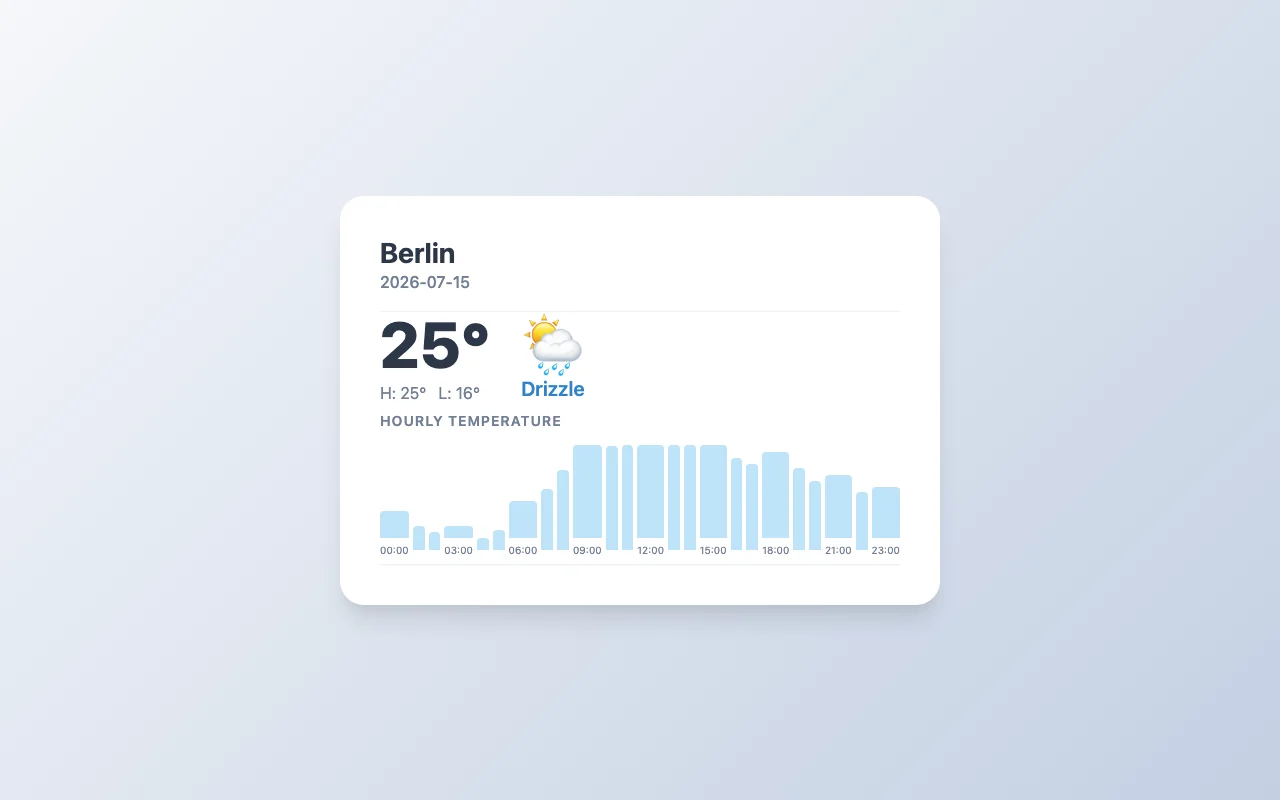
截图是 similarity 通道测量时的原始像素。运行 live 会在 sandboxed iframe 中重新执行原始输出;渲染结果取决于你的浏览器和字体,不保证与测量像素一致。
similarity 邻居
最近
minimax-m2.1 · kiro0.69minimax-m2.5 · go0.65doubao-seed-2-1-pro-260628 @disabled · api0.65gpt-5.6-luna @medium · cursor-xl0.64kimi-k2.6 · go0.64最远
grok-4.6 @high · api0.48grok-4.6 @medium · grok-cli0.49claude-sonnet-4-6-thinking @medium · cursor0.49cursor-grok-4.6 @high · cursor-xl0.49claude-opus-4-8 @max · CC0.49限于 session 2026-07-19--unified
similarity 衡量本 session 内的趋同程度 —— 不是质量。
Fidelity —— 卡片展示的数据对不对?
- namematch
- conditionmatch
- datematch
- max tempambiguous展示值:25max-equals-min
- min tempambiguous展示值:25max-equals-min
- hourlyambiguouscoverage · 0 命中 · 0 不符 · 24 未展示
- request sidematch0 处违规
extractor fidelity-extractor-v1+Berlin-2026-07-15
源码 —— 原始模型输出,一字节未改
下载 card.html<!DOCTYPE html>
<html lang="en">
<head>
<meta charset="UTF-8">
<meta name="viewport" content="width=device-width, initial-scale=1.0">
<title>Weather Card</title>
<style>
:root {
--bg-gradient: linear-gradient(135deg, #f5f7fa 0%, #c3cfe2 100%);
--card-bg: #ffffff;
--text-primary: #2d3748;
--text-secondary: #718096;
--accent: #3182ce;
--danger: #e53e3e;
--font-family: -apple-system, BlinkMacSystemFont, "Segoe UI", Roboto, Helvetica, Arial, sans-serif;
}
* {
box-sizing: border-box;
margin: 0;
padding: 0;
}
body {
font-family: var(--font-family);
background: var(--bg-gradient);
height: 100vh;
width: 100vw;
display: flex;
align-items: center;
justify-content: center;
color: var(--text-primary);
overflow: hidden;
}
.card {
background: var(--card-bg);
width: 600px;
border-radius: 24px;
box-shadow: 0 20px 25px -5px rgba(0, 0, 0, 0.1), 0 10px 10px -5px rgba(0, 0, 0, 0.04);
padding: 40px;
display: flex;
flex-direction: column;
gap: 24px;
transition: opacity 0.3s ease;
}
.header {
display: flex;
justify-content: space-between;
align-items: flex-start;
border-bottom: 1px solid #edf2f7;
padding-bottom: 20px;
}
.location-info h1 {
font-size: 28px;
font-weight: 700;
margin-bottom: 4px;
color: var(--text-primary);
}
.location-info .date {
font-size: 16px;
color: var(--text-secondary);
font-weight: 500;
}
.main-weather {
display: flex;
align-items: center;
gap: 30px;
}
.temp-display {
display: flex;
flex-direction: column;
}
.current-temp {
font-size: 64px;
font-weight: 800;
line-height: 1;
color: var(--text-primary);
}
.temp-range {
font-size: 16px;
color: var(--text-secondary);
margin-top: 8px;
display: flex;
gap: 12px;
}
.temp-range span {
display: flex;
align-items: center;
gap: 4px;
}
.weather-icon {
font-size: 64px;
line-height: 1;
}
.weather-desc {
font-size: 20px;
font-weight: 600;
color: var(--accent);
text-transform: capitalize;
}
.hourly-section {
margin-top: 10px;
}
.section-title {
font-size: 14px;
text-transform: uppercase;
letter-spacing: 1px;
color: var(--text-secondary);
margin-bottom: 16px;
font-weight: 600;
}
.chart-container {
display: flex;
align-items: flex-end;
justify-content: space-between;
height: 120px;
gap: 4px;
padding-bottom: 8px;
border-bottom: 1px solid #edf2f7;
}
.bar-group {
display: flex;
flex-direction: column;
align-items: center;
flex: 1;
height: 100%;
justify-content: flex-end;
position: relative;
}
.bar {
width: 100%;
background-color: #bee3f8;
border-radius: 4px 4px 0 0;
transition: height 0.5s ease-out, background-color 0.2s;
min-height: 4px;
}
.bar:hover {
background-color: var(--accent);
}
.bar-label {
font-size: 10px;
color: var(--text-secondary);
margin-top: 6px;
text-align: center;
}
.error-msg {
color: var(--danger);
text-align: center;
font-size: 18px;
padding: 40px;
background: #fff5f5;
border-radius: 12px;
border: 1px solid #feb2b2;
}
.loading {
text-align: center;
color: var(--text-secondary);
font-size: 18px;
}
/* Utility for hiding elements */
.hidden {
display: none !important;
}
</style>
</head>
<body>
<div class="card" id="weather-card">
<div class="loading" id="loading-state">Loading weather data...</div>
<div id="content-state" class="hidden">
<div class="header">
<div class="location-info">
<h1 id="loc-name">Location</h1>
<div class="date" id="date-display">Date</div>
</div>
</div>
<div class="main-weather">
<div class="temp-display">
<div class="current-temp" id="main-temp">--°</div>
<div class="temp-range">
<span id="max-temp">H: --°</span>
<span id="min-temp">L: --°</span>
</div>
</div>
<div style="text-align: center;">
<div class="weather-icon" id="weather-icon">☁️</div>
<div class="weather-desc" id="weather-desc">Condition</div>
</div>
</div>
<div class="hourly-section">
<div class="section-title">Hourly Temperature</div>
<div class="chart-container" id="hourly-chart">
<!-- Bars injected via JS -->
</div>
</div>
</div>
<div id="error-state" class="hidden">
<div class="error-msg">
Unable to load weather data. Please check your connection or parameters.
</div>
</div>
</div>
<script>
(function() {
// 1. Parse URL Parameters
const params = new URLSearchParams(window.location.search);
const lat = params.get('lat') || '52.52';
const lon = params.get('lon') || '13.405';
const name = params.get('name') || 'Berlin';
// Default date to today UTC
let dateParam = params.get('date');
if (!dateParam) {
const now = new Date();
dateParam = now.toISOString().split('T')[0];
}
// 2. Determine Endpoint (Archive vs Forecast)
const todayUTC = new Date().toISOString().split('T')[0];
// If requested date is in the past (strictly less than today), use archive.
// Otherwise use forecast.
const isPast = dateParam < todayUTC;
const endpoint = isPast ? '/api/om/archive' : '/api/om/forecast';
// 3. Construct API URL
const apiUrl = `${endpoint}?latitude=${lat}&longitude=${lon}&daily=temperature_2m_max,temperature_2m_min,weather_code&hourly=temperature_2m&timezone=UTC&temperature_unit=celsius&start_date=${dateParam}&end_date=${dateParam}`;
// 4. DOM Elements
const loadingState = document.getElementById('loading-state');
const contentState = document.getElementById('content-state');
const errorState = document.getElementById('error-state');
const locNameEl = document.getElementById('loc-name');
const dateDisplayEl = document.getElementById('date-display');
const mainTempEl = document.getElementById('main-temp');
const maxTempEl = document.getElementById('max-temp');
const minTempEl = document.getElementById('min-temp');
const weatherIconEl = document.getElementById('weather-icon');
const weatherDescEl = document.getElementById('weather-desc');
const hourlyChartEl = document.getElementById('hourly-chart');
// 5. Helper: WMO Code Interpretation
function getWeatherInfo(code) {
// Simplified mapping based on Open-Meteo WMO codes
if (code === 0) return { desc: 'Clear sky', icon: '☀️' };
if ([1, 2, 3].includes(code)) return { desc: 'Partly cloudy', icon: '⛅' };
if ([45, 48].includes(code)) return { desc: 'Fog', icon: '🌫️' };
if ([51, 53, 55, 56, 57].includes(code)) return { desc: 'Drizzle', icon: '🌦️' };
if ([61, 63, 65, 66, 67, 80, 81, 82].includes(code)) return { desc: 'Rain', icon: '🌧️' };
if ([71, 73, 75, 77, 85, 86].includes(code)) return { desc: 'Snow', icon: '❄️' };
if ([95, 96, 99].includes(code)) return { desc: 'Thunderstorm', icon: '⛈️' };
return { desc: 'Unknown', icon: '❓' };
}
// 6. Fetch and Render
fetch(apiUrl)
.then(response => {
if (!response.ok) throw new Error('Network response was not ok');
return response.json();
})
.then(data => {
if (!data.daily || !data.daily.time || data.daily.time.length === 0) {
throw new Error('No data returned for this date');
}
const daily = data.daily;
const hourly = data.hourly;
// Extract Daily Data (index 0 since start_date == end_date)
const maxTemp = Math.round(daily.temperature_2m_max[0]);
const minTemp = Math.round(daily.temperature_2m_min[0]);
const weatherCode = daily.weather_code[0];
const weatherInfo = getWeatherInfo(weatherCode);
// Extract Hourly Data for this specific day
// The API returns hourly arrays. We need to find the slice corresponding to the date.
// Since we requested start_date=end_date, the hourly array should ideally align,
// but Open-Meteo returns 24h or more. We filter by the date string in hourly.time.
const dayHourlyTemps = [];
const dayHourlyTimes = [];
hourly.time.forEach((timeStr, index) => {
if (timeStr.startsWith(dateParam)) {
dayHourlyTemps.push(hourly.temperature_2m[index]);
// Format time for label (HH:00)
const timePart = timeStr.split('T')[1];
dayHourlyTimes.push(timePart.substring(0, 5));
}
});
// Update DOM
locNameEl.textContent = name;
dateDisplayEl.textContent = dateParam;
// Use Max Temp as the "Main" display if no current hourly is preferred,
// or we could pick the closest hour to now. Let's use Max Temp for visual impact on a daily card.
mainTempEl.textContent = `${maxTemp}°`;
maxTempEl.textContent = `H: ${maxTemp}°`;
minTempEl.textContent = `L: ${minTemp}°`;
weatherIconEl.textContent = weatherInfo.icon;
weatherDescEl.textContent = weatherInfo.desc;
// Render Hourly Chart
renderChart(dayHourlyTemps, dayHourlyTimes);
// Switch Views
loadingState.classList.add('hidden');
contentState.classList.remove('hidden');
})
.catch(err => {
console.error(err);
loadingState.classList.add('hidden');
errorState.classList.remove('hidden');
});
function renderChart(temps, times) {
hourlyChartEl.innerHTML = '';
if (temps.length === 0) return;
const minVal = Math.min(...temps);
const maxVal = Math.max(...temps);
const range = maxVal - minVal || 1; // Avoid divide by zero
temps.forEach((temp, index) => {
const group = document.createElement('div');
group.className = 'bar-group';
const bar = document.createElement('div');
bar.className = 'bar';
// Calculate height percentage relative to the day's range
// Base height 10% so min temp is visible
const heightPercent = ((temp - minVal) / range) * 90 + 10;
bar.style.height = `${heightPercent}%`;
// Tooltip logic could go here, but keeping it simple per constraints
bar.title = `${times[index]}: ${Math.round(temp)}°C`;
const label = document.createElement('div');
label.className = 'bar-label';
// Show label every 3 hours to prevent crowding, or just first/last
if (index % 3 === 0 || index === temps.length - 1) {
label.textContent = times[index];
} else {
label.textContent = '';
}
group.appendChild(bar);
group.appendChild(label);
hourlyChartEl.appendChild(group);
});
}
})();
</script>
</body>
</html>L1 —— 廉价的确定性描述量
| bytes 总计 | 14,030 | html / css / js | 1,777 / 4,481 / 7,772 |
|---|---|---|---|
| dom 节点 | 29 | dom 深度 | 8 |
| css 规则 | 24 | 含 js | 是 |
| brightness | 230.7 | contrast | 15.8 |
| colorfulness | 14.2 | 留白 | 98.7% |
该 slot 的 telemetry
| prompt tokens | 337 | completion tokens | 4,821 |
|---|---|---|---|
| total tokens | 5,158 | wall | 83.3 s |
| cost | — | request id | — |
config.json552 B
{
  "N": 2,
  "auth": {
    "credential_ref": "WCB_OPENCODE_KEY",
    "method": "oauth-login"
  },
  "billing": "plan",
  "config_id": "qwen3.5-plus--opencode-go--dev",
  "effort": null,
  "family": "qwen",
  "m": {
    "min": 2,
    "q": 2
  },
  "model_id": "qwen3.5-plus",
  "protocol": "api",
  "served_model": "qwen3.5-plus",
  "telemetry": {
    "completion_tokens": 19124,
    "cost_usd": null,
    "prompt_tokens": 1330,
    "total_tokens": 20454,
    "wall_ms": 331066
  },
  "transport": "opencode-go-gateway",
  "vendor_sanction_ref": null
}send-log2.5 KB
{
  "N": 2,
  "batch_id": "2026-07-18--dev-go-extra",
  "config_id": "qwen3.5-plus--opencode-go--dev",
  "positions": [
    {
      "attempts": [
        {
          "attempt_index": 0,
          "backoff_ms": null,
          "charged": true,
          "ended_at": "2026-07-18T00:24:36.364452+00:00",
          "http_status": 200,
          "outcome": "valid",
          "reached_model": true,
          "reason": "ok",
          "request_id": null,
          "started_at": "2026-07-18T00:23:31.111439+00:00"
        }
      ],
      "block_index": 0,
      "model_reaching_attempt_index": 0,
      "slot_index": 0,
      "terminal_state": "valid",
      "variant": "P-min"
    },
    {
      "attempts": [
        {
          "attempt_index": 0,
          "backoff_ms": null,
          "charged": true,
          "ended_at": "2026-07-18T00:26:02.517950+00:00",
          "http_status": 200,
          "outcome": "valid",
          "reached_model": true,
          "reason": "ok",
          "request_id": null,
          "started_at": "2026-07-18T00:24:39.168452+00:00"
        }
      ],
      "block_index": 0,
      "model_reaching_attempt_index": 0,
      "slot_index": 0,
      "terminal_state": "valid",
      "variant": "P-q"
    },
    {
      "attempts": [
        {
          "attempt_index": 0,
          "backoff_ms": null,
          "charged": true,
          "ended_at": "2026-07-18T00:27:46.168775+00:00",
          "http_status": 200,
          "outcome": "valid",
          "reached_model": true,
          "reason": "ok",
          "request_id": null,
          "started_at": "2026-07-18T00:26:05.930342+00:00"
        }
      ],
      "block_index": 1,
      "model_reaching_attempt_index": 0,
      "slot_index": 1,
      "terminal_state": "valid",
      "variant": "P-q"
    },
    {
      "attempts": [
        {
          "attempt_index": 0,
          "backoff_ms": null,
          "charged": true,
          "ended_at": "2026-07-18T00:29:12.109835+00:00",
          "http_status": 200,
          "outcome": "valid",
          "reached_model": true,
          "reason": "ok",
          "request_id": null,
          "started_at": "2026-07-18T00:27:49.919985+00:00"
        }
      ],
      "block_index": 1,
      "model_reaching_attempt_index": 0,
      "slot_index": 1,
      "terminal_state": "valid",
      "variant": "P-min"
    }
  ],
  "retry_policy": {
    "max_unreachable_retries": 5,
    "rate_limit_backoff": {
      "max_attempts": 4,
      "max_total_ms": 60000
    }
  }
}